
Friday 24 February 2017
Tuesday 21 February 2017
YYC Tableau Seminar Feb. 2017
I attended the Tableau seminar in Calgary this week and learned about the Top 10 Business Intelligence Trends for 2017. In addition, Alberta Health Services and QuICR made presentations explaining how they use Tableau to enhance their day-to-day operations.
1. The Modern Business Intelligence (BI) Model
With the role of data discovery shifting from a centralize IT department to individual businesses, the modern BI (project) model means a shift from the traditional waterfall approach to an agile model.
2. Collaborative Analytics
Open data sources provide more data to discover, but also fosters a collaborative environment. When data is shared, more insight is uncovered, and better decisions can then be made (see presentation by AHS and QuICR below).
3. All Data Becomes Equal
Tableau allows users to connect to multiple data sources and does not discriminate on their size. Cross referencing data from Oracle and Excel becomes a walk in the park.
4. Self-Serve Extends to Data Preparation
According to Howard, Tableau reinvests >30% of its revenue in R&D and is working heavily on improving its data preparation usability and functions. Their hope is to extend not only the data discovery / visualization portion of the fun to (business user) self-serve, but the data preparation portion as well. With Project Maestro underway, I certainly look forward to the good days of data preparation, which are apparently still ahead of us.
5. Embedded Business Intelligence
Embedded BI will become the norm of the future, with some companies already creating seamless dashboards right on their web pages, and others, pushing the boundaries of Tableau's functionalities (such as write-back).
6. IT Becomes the Data Hero Again
The hope of self-serve is to shift IT from the role of report creators back to data enablers. Instead of being the bottle neck, IT will once again be the data hero every organization needs.
7. Work with Data in More Natural Ways
Howard spoke to this point by comparing a crosstab with a graph, explaining that as data gets presented visually, people will be able to work with data in more "natural" ways.
8. Cloud
According to Howard, Canadian companies struggle with the idea of hosting their data on the cloud due to a shortage of servers being physically in Canada. But that's changing as companies increase their physical presence in Canada (such as Amazon Web Services)
9. Advanced Analytics Becomes More Accessible
Tableau hopes that advanced analytics will become more accessible with their various platforms, enabling businesses to gain more in depth insight to their data.
10. Data Literacy Becomes a Fundamental Skill
Howard believes that data literacy will become a fundamental skill in the future, just like how the ability to use the Microsoft Office Suite has become a basic requirement to do one's job.
PRESENTATION BY AHS & QUICR
Alberta Health Services and QuICR demonstrated some of their dashboards and talked about the impact Tableau had on their day-to-day operations. These real-life applications were really interesting, and my main take-away points were:
Door to Needle - QuICR

TOP 10 BI TRENDS with Howard Morgenstern (@datacanuck)
1. The Modern Business Intelligence (BI) Model
With the role of data discovery shifting from a centralize IT department to individual businesses, the modern BI (project) model means a shift from the traditional waterfall approach to an agile model.
2. Collaborative Analytics
Open data sources provide more data to discover, but also fosters a collaborative environment. When data is shared, more insight is uncovered, and better decisions can then be made (see presentation by AHS and QuICR below).
3. All Data Becomes Equal
Tableau allows users to connect to multiple data sources and does not discriminate on their size. Cross referencing data from Oracle and Excel becomes a walk in the park.
4. Self-Serve Extends to Data Preparation
According to Howard, Tableau reinvests >30% of its revenue in R&D and is working heavily on improving its data preparation usability and functions. Their hope is to extend not only the data discovery / visualization portion of the fun to (business user) self-serve, but the data preparation portion as well. With Project Maestro underway, I certainly look forward to the good days of data preparation, which are apparently still ahead of us.
5. Embedded Business Intelligence
Embedded BI will become the norm of the future, with some companies already creating seamless dashboards right on their web pages, and others, pushing the boundaries of Tableau's functionalities (such as write-back).
6. IT Becomes the Data Hero Again
The hope of self-serve is to shift IT from the role of report creators back to data enablers. Instead of being the bottle neck, IT will once again be the data hero every organization needs.
7. Work with Data in More Natural Ways
Howard spoke to this point by comparing a crosstab with a graph, explaining that as data gets presented visually, people will be able to work with data in more "natural" ways.
8. Cloud
According to Howard, Canadian companies struggle with the idea of hosting their data on the cloud due to a shortage of servers being physically in Canada. But that's changing as companies increase their physical presence in Canada (such as Amazon Web Services)
9. Advanced Analytics Becomes More Accessible
Tableau hopes that advanced analytics will become more accessible with their various platforms, enabling businesses to gain more in depth insight to their data.
10. Data Literacy Becomes a Fundamental Skill
Howard believes that data literacy will become a fundamental skill in the future, just like how the ability to use the Microsoft Office Suite has become a basic requirement to do one's job.
PRESENTATION BY AHS & QUICR
Alberta Health Services and QuICR demonstrated some of their dashboards and talked about the impact Tableau had on their day-to-day operations. These real-life applications were really interesting, and my main take-away points were:
- More transparency through information sharing
- Greater synergy leveraged through each others' strengths
- Faster learning through knowledge / process / performance sharing
Door to Needle - QuICR
Door-to-needle is the time between a patient gets in the (hospital / treatment centre) door to when they receive treatment, and is a critical time measurement for acute ischemic stroke patients. As neurons are lost each second, a shorter door-to-needle time may mean saving a life. QuICR uses Tableau to analyze door-to-needle time across multiple locations and was able to better improve the door-to-needle time of not just locations with poorer performances, but even the better performing ones as well. The speaker said that when locations with poor performance see that a 30 minutes door-to-needle time was achievable in other locations, it gave them the confidence that they will be able to achieve that one day as well.
Friday 17 February 2017
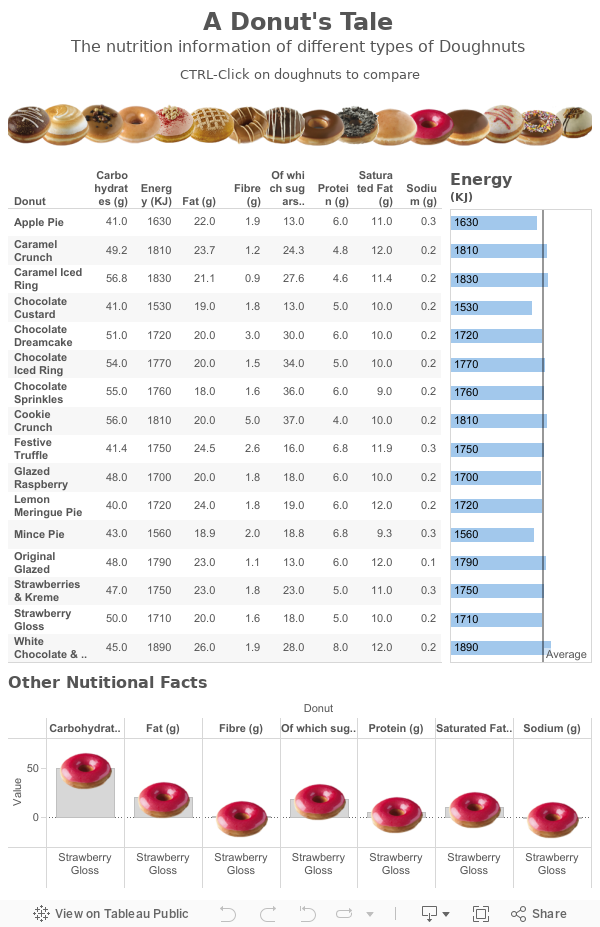
A Donut's Tale
This is a dashboard I made while taking the Tableau Visual Analytics course. The course was really worth it actually. Instead of building on top of the Fundamentals and Advance curriculum, it kind of binds everything together and challenges our way of thinking by putting our hard skills to use. Perhaps some day I'll dive into more details.
My hope is that I can continually make dashboards that not only look nice but is functional and of actual interest to me. But because I work a full time and a part time job, to be honest, it's hard to want to spend what little spare time I have left to "work" more.
But my hope is to one day work completely remotely so it is important to me. So wish me luck, and I hope to see you here again soon!
Subscribe to:
Posts (Atom)